Tag Archives: Selling a Home in Rancho Santa fe

Best Priced Homes In Rancho Santa Fe 92067 – Rina Podolsky Carmel Valley Real Estate-Rina & Sergio San Diego Exclusive Properties-

13 Dec

This slideshow requires JavaScript.

Being a Real Estate agent, there are some questions that I get asked very often, most of them can be summed up basically in How is the market? Have we hit bottom yet? Is it the right time to buy or sell? and, How much is my Home worth? That is as far as people’s questions for me go. Now the most common answer I get is when I ask a buyer, what are you looking for? the most common answer has to be…A deal! There is no, I want to buy a 4 bedroom home in Carmel Valley or a single story house in La Jolla, no I want a home in Rancho Santa Fe with 2 acres of land, it is a one answer fits all!

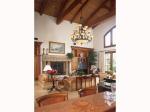
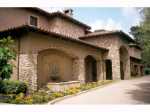
Now, a deal is something that needs to be defined carefully, it does not mean the same thing to everyone, you have to pay close attention to different variables. However, I will be putting together periodical postings of  “Great Deals”. This time I am starting with incredibly great priced Homes for Sale in Rancho Santa Fe, California. As you very well may know, Rancho Santa Fe is considered one of the most expensive zip codes in the country.  In today’s market, that is precisely where any expert will agree, you will find the best opportunities in our current market, The high end Real Estate Market was slow to feel the crash of the housing market, yet it has felt it by now and continues to do so. There are multiple reasons that explain this but the most important ones would be the lack of jumbo loans and the fact that many people who own expensive homes held on longer to their properties but have started falling into foreclosures a little later in the game.

Here are my top picks por great priced properties in Rancho Santa Fe:

*Click on any of the images bellow for more detailed information.

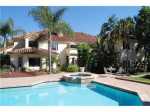
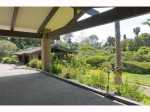
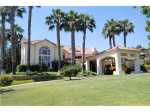
Deal #1 @$191 per S.F.

$191 per S.F. WOW!!!!

1.- $191 per S.F.!!!!

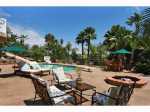
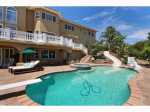
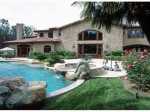
Pool

Pool

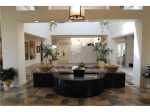
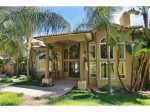
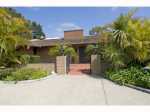
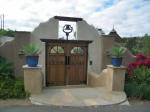
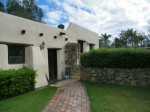
Entrance

Entrance

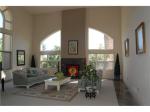
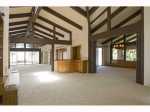
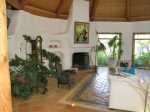
Living Room

Deal #2 @$299 per S.F.

$299 per S.F.

Pool

Pool

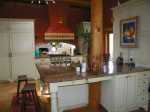
Kitchen

Kitchen

Family Room

Deal # 3 @ $307 per S.F.

$307 per S.F.

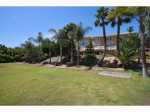
Backyard

Pool

Expansive Yard

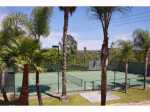
Tennis Court

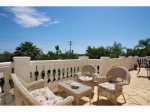
Balcony/View

Kitchen

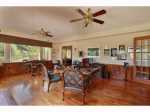
Office

Deal #4 @ $311 per S.F.

$311 per S.F.

Indoor / outdoor Living

Exposed Beams

Kitchen

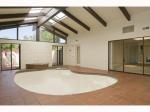
Indoor Pool

Deal # 5 @ $316 per S.F.

$316 per S.F.

Unique Adobe Style Entrance

Vega Wood Beams

Living Room

Kitchen

Master Bedroom

Outside Detail

Deal #6 @ $339 per S.F.

$339 per S.F.

Pool

Foyer

Family Room

Kitchen / Nook

Dining Room

Dining Room

Master Bedroom

Office

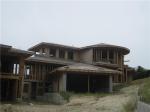
Deal #7  This is more of a special mention. It is NOT yet completed!!! It will require some money to be built out. $156 per S.F.

Bank Owned Home $156 per S.F.

If you would like any details on any of these Homes for Sale please contact me and I will be happy to provide them for you. This are great buying opportunities in a a very exclusive area that will eventually get back up. It has the name, the great schools and prices won’t stay low forever, and even though the high-end market it’s not expected to come back for a year or so, this homes are way bellow market value so that even with falling prices you are still buying a great deal!

As far as Market Statistics for Rancho Santa Fe, there are currently 213 Homes listed for Sale 9 Homes listed as being Contingent, 27 Homes in Escrow and 11 Homes that have Sold in the last 30 days. Of the homes that Sold in the last 30 days They had the Following averages: 130 Days on Market, Sold for 89% of Asking Price, at $424.67 pers S.F. $2,946,172 was the average selling price.

Please leave a comment or if you have any questions you can contact us at www.SanDiegoExclusiveProperties.com or Follow us on Facebook http://www.facebook.com/?ref=logo#!/group.php?gid=123662939207 and twitter http://twitter.com/RinaPodolsky

How is the Market? Understanding The Case Schilling Report – Rina Podolsky Carmel Valley Homes For Sale-

1 Dec

As a real estate agent I often come in contact with people who ask me, How is the market? followed by a statement, I just saw the latest report saying…. Although some people do get the idea behind what the numbers show, often times they have either taken that information to be a prediction or have trouble understanding what the numbers really mean. What they really want to know most of the time is;  is it the right time to buy? should I sell my home now or wait a bit? Is it the right market to invest?  So I thought I share with all of you a glimpse as to how and why you should interpret this indicators with care, specially because what happens to Real Estate in New York City is very different than what happens to Real Estate in Carmel Valley Real Estate or La Jolla Real Estate or Rancho Santa Fe Real Estate.

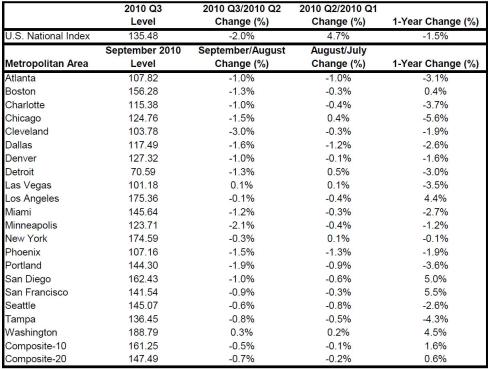
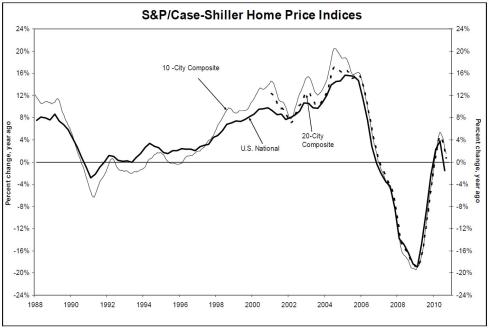
Case Schilling reported their numbers for the September behavior of the Market and it is calling it a “weak report” in fact they believe it is even weaker than last months report. However it is important to understand that they believe that this results are believed to be highly influenced by the end of the government’s incentive programs.  I believe this numbers were to be expected, many of the people who were ready to buy, did so in time to take advantage of all the government credits and incentives, pushing the number higher for several months. Another fact that might have influenced the numbers is the fact that the interest rates have been going down and people keep hearing of a new wave of foreclosures, and a possible second dip in home prices and because they have no time concerns after the credits expired, many people have gone back to sitting on the fences and waiting to have a clearer picture of how the market will be trending.

Another important fact to take into consideration is that Case Schilling is reporting what has happened in the past few months, since this report came out, there has been some better than expected numbers from different indicators, Wall Street broke to pre crash levels, unemployment has started to shift, the government has said it will be pumping 600 million to re-invest , consumer confidence is higher than expected and so are the results of gains of many of the large corporations.

I would like to point out that if you look at the graph, you can see that the 20 city index shows that the market is up above 2003 price levels. ” From their peak in June/July of 2006 through the trough in April 2009, the 10-City Composite is down 33.5% and the 20-City Composite is down 32.6%. Through September, they have recovered by +7.2%and +5.9%, respectively. The peak-to-date figures through September 2010 are -28.7% and -28.6%,respectively.” 

Lastly, Case Schilling is a snapshot of the country, taken from 10 or 20 cities, it is important to understand that each market behaves differently. For example, if you look at the local San Diego market, you see that it actually is showing a 5.0% GAIN from the 2009 levels, not a loss by any means and if you take it a step further you can see that even within San Diego, you have to look at each area separately, some have had bigger gains, some have shown a steadier path through the whole crisis and some have shown some losses in the last months. This is why it is very important to know what you are looking at and be careful when you interpret any charts or information to make decisions based on them. Be sure to always ask an expert.

If you would like to see more detailed information you can go to:  http://www.standardandpoors.com/servlet/BlobServer?blobheadername3=MDT-Type&blobcol=urldocumentfile&blobtable=SPComSecureDocument&blobheadervalue2=inline%3B+filename%3Ddownload.pdf&blobheadername2=Content-Disposition&blobheadervalue1=application%2Fpdf&blobkey=id&blobheadername1=content-type&blobwhere=1245262947491&blobheadervalue3=abinary%3B+charset%3DUTF-8&blobnocache=true

Please feel free to contact us for any questions or you can go to our web site www.SanDiegoExclusiveProperties.com

our facebook page : http://www.facebook.com/?sk=messages&tid=457977665291#!/group.php?gid=123662939207

or follow me on twitter: http://twitter.com/RinaPodolsky

September 2010 S&P/Case-Shiller Home Price IndicesS&P/Case-Shiller U.S. National Home Price Index